Cornucopia of mathematics

This image was originally developed as the focal point of the National Mathematics Awareness Month poster of April 2000. The theme was “Math Spans All Dimensions”. It was too lovely to be retired, and appeared again to commemorate 47 years of teaching mathematics at Brown University by Emeritus Professor and geometer Thomas Banchoff.

cornucopia

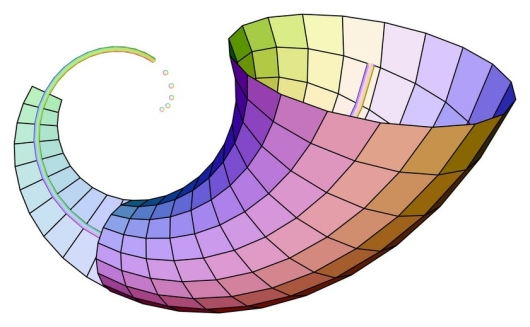
According to the artist, it is suffused with joy, just as I had hoped! It begins with mere points, then a curve that flares into a spiral, and eventually a colorful 3-D cornucopia of mathematical plenty:

suggesting the possibility of further dimensions yet to come.

I encourage paying a visit to the mathematical artwork page. There are Klein bottles, sliced torii, the spectacular Steiner’s Roman Surface and much more to be found there. 
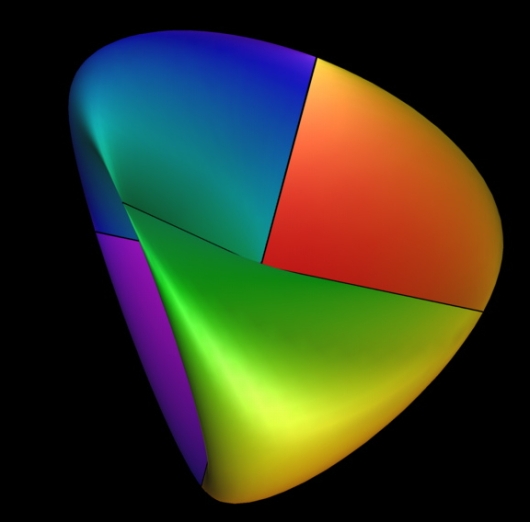
3d math art

Roman Surface

April 2020 was the scheduled date for the most recent National Mathematics and Statistics Awareness Month. It is a biannual event, i.e. held once every two years. Sadly, it was uniquely ill-timed to coincide with the arrival of the COVID-19 global pandemic.

Possibly even worse is the fact that I saw no mention of any activities for 2022. I noticed this while browsing through the pages of the Mathematical Imagery SIG (special interest group) of the American Mathematical Society (AMS).

On the origins of Mathematics Awareness Month

As any blog reader of mine knows, I strive to find surprising information. The origin of AMS’s Mathematics and Statistics Awareness Month can be traced back to none other than… Ronald Reagan? Yes, former U.S. President Reagan established the event in 1986, by Presidential Proclamation, with the following announcement:

Despite the increasing importance of mathematics to the progress of our economy and society, enrollment in mathematics programs has been declining at all levels of the American educational system. Yet the application of mathematics is indispensable in such diverse fields as medicine, computer sciences, space exploration, the skilled trades, business, defense, and government. To help encourage the study and utilization of mathematics, it is appropriate that all Americans be reminded of the importance of this basic branch of science to our daily lives.

—via President Ronald Reagan in Proclamation 5461 – National Mathematics Awareness Week (PDF), April 17, 1986

If Reagan had only known what would happen in the future maybe he would have made it an executive order instead of a mere proclamation.

Professor Banchoff’s art work has even graced some book covers, including this one, written by my favorite statistician.


Published in: on 10 November 2022 at 2:38 pm  Comments (3)  
Tags:

Looking back: FBI director nominee James Comey

The Trump presidency has had its share of controversy. If anything, it has gone from one upheaval to another. Each incident, whether minor or significant, has been amplified, even distorted, for page clicks and profit by the American news media.

Trump’s favorite fake news

I used to read the online New York Times. I often commented on articles. New York Times provides a persistent URL, called a permalink, for each online reader comment. It’s a nice feature!

Too bad the paper’s content isn’t so great. I can do without The 1619 Project, 1oo pages of historical revisionism crammed into an August 2019 New York Times Magazine issue that reveals

a new version of American history in which slavery and white supremacy become the dominant organizing themes.

Former FBI director James Comey

James Comey was nominated as FBI director by President Obama in June 2013 and promptly confirmed by the US Senate.  Given the drama surrounding his role in the 2016 election (i.e. not recommending a Department of Justice investigation of Democrat candidate Hillary Clinton for her use of a private email server while Secretary of State, then reopening the inquiry a month prior to the general election), followed by President Trump’s controversial dismissal of Comey, I think the Times article covering Comey’s nomination remains of interest. (more…)

US Mint ends production of one dollar coins

Awhile ago, Last Tuesday, 13 December 2011, the U.S. Mint announced that production of one dollar coins is ending.  A few one dollar coins will still be minted for collectors, as required by law:

Instead of producing 70-80 million coins per presidential administration,  the Mint will now only produce as many as collectors order.

These coins will have numismatic value, and as such will cost far more than their $1 face value. Circulating demand for $1 coins will be met with existing Federal Reserve stockpiles until they are depleted.

reverse face of 2010 Native American one dollar coin

$1 coin: Hiawatha belt bundles 5 arrows symbolizing 5 nations of the Iroquois Confederacy via US Mint 2010

Unwanted

The $1 coins would have saved hundreds of millions of dollars, as they are more durable than paper money. Despite being a more sustainable, environmentally friendly alternative to paper currency, they were never popular with the American public: 40% of $1 coins were returned, unwanted, to the Federal Reserve each year.

My favorite $1 coin featured Sacagawea, guide to Lewis and Clark, on the 2010 Native American dollar coin. Sacagawea is on the obverse side. The image above is the reverse side. (more…)

Published in: on 21 June 2020 at 8:10 am  Comments (6)  
Tags: , , , , ,

Not so current developments in typography

I wrote this post about the Indian rupee some years ago but never published it. Given the feeling of time suspended brought on by COVID-19 shelter-in-place orders (and suspension of normal life in general), I decided to publish rather than discard it.

My initial motivation was to come up with something interesting to say using combinations and permutations in meaning of the words “economics”, “typography”, “development”, and “current”. I DO love typography!

Currency of developing economies

Most countries have distinct identification symbols for their currencies, but until 2011, there was no official currency sign for the Indian rupee. Only `Rs’ was used to represent it.  India shared the abbreviated form of the rupee with Pakistan, Nepal, Seychelles and Sri Lanka.

India’s finance ministry organized a public competition to design a new symbol for the rupee. The successful designer was awarded Rs 2.5 lakh, but had to surrender the copyright to the government of India. The symbol chosen was

which is U+20B9 in Unicode and ₹ in HTML. It is a blend of the Devanagri ‘Ra’ and Roman ‘R’. (more…)

Published in: on 9 April 2020 at 6:03 am  Leave a Comment  
Tags: , , , , , , , ,

Cutting corners on telecom infrastructure with Huawei

In January 2013, I wrote a Quora blog post about Huawei’s twisty, winding path to prominence. There were plenty of oddities, e.g. Huawei was supplier to the Taliban, and later, was nearly acquired by GOP presidential Mitt Romney… but not at the same time!

Huawei is back in the limelight. Curiously, the problem is not one of Chinese state interference but of sloppy software development. I’ll get to that, but first, let’s take an illustrated tour of the Huawei story.

A casual Huawei timeline

2001 – Huawei India faces allegations that it had developed telecommunications equipment used by the Taliban in Afghanistan.

Huawei greeters at ITU World Telecom 2007 but probably not for the Taliban

2010 – Reuters reports that a partner of Huawei tried to sell embargoed Hewlett-Packard computer equipment to Iran‘s largest mobile-phone operator.

Huawei at mobile device trade show convention in Iran

2011 – The Australian government excludes Huawei from tendering contracts with a government-owned corporation constructing a broadband network.

2012 – The Canadian government excludes Huawei from plans to build a secure government communications network.

Huawei phone Pegasus, Barcelona 2012

2013 – The U.S.- China Economic & Security Review Commission advised Congress about Chinese government influence on Huawei.

2013 – Reuters investigative report following receipt of a letter from a concerned Los Alamos National Labs (LANL) employee:

[LANL] had installed devices made by H3C Technologies Co [which] raises questions about procurement practices by U.S. departments responsible for national security.

The devices were Chinese-made switches used for managing data traffic on LANL computer networks. Huawei’s relationship with Chinese military was mentioned.

(more…)

Published in: on 23 October 2019 at 5:48 am  Comments (3)  
Tags: , , , , , ,

Why is Norway is expanding its armed forces now?

The Norwegian government posted this brief video specifically for the benefit of English-speaking audiences a few weeks ago. The YouTube comments are turned off, but the description reads as follows,

“We asked the question: Why do we need the armed forces and a military? In the end what do we, as a nation, want to happen? This is the answer.”

The video is brief and well-produced. I’ll provide that referenced answer after the jump just in case anyone will consider it a spoiler for me to do otherwise.

(more…)

Published in: on 20 January 2019 at 3:38 pm  Comments (2)  
Tags: , , , ,

Yet another academic plagiarism scandal: blockchains, medical research, and patents

One must be intrinsically motivated to be ethical and honest. Integrity cannot be imposed by peer review.

This is not another SFYL (sorry for your loss) tale of cryptocurrency scamming. That is merely a grace note. Academic plagiarism can happen, regardless of whether bitcoin, blockchains, or cryptocurrency are involved.

One’s own professional community, and the moral implications of having lied and plagiarized i.e. shame, should be enough to keep scientific and other original researchers (and investigatory work in general) honest. It clearly isn’t. I make that observation based on this passage via Andrew Gelman (emphasis mine): (more…)

Published in: on 16 November 2018 at 6:28 am  Comments (7)  
Tags: , , , , , ,

Growth of the early Internet, node by node

Network diagrams are a popular way of visualizing social and corporate relationships. Network theory has been used to model telecommunications performance and especially, the Internet. Communications networks increase in value as the number of connections increases. Metcalfe’s Law attempts to quantify the increased value.

Optimizing Metcalfe’s Law

For a network with n members, Metcalfe’s Law posits that the total value of that network is proportional to n * (n-1). Metcalfe’s Law as applied to the Internet, and even to the telephone network, is only valid if all connections have equal value. This is incorrect. Some internet connections are hardly used and contribute limited value. Of course, there are reasons to connect everyone that are not based on monetary value! Rural electrification is an example.

Andrew Odlyzko’s article about Metcalfe’s Law (IEEE Spectrum, 2006) was written with a keen awareness of the 2000 dotcom bubble. Odlyzko demonstrated how Metcalfe’s Law’s applicability could be limited by the equal value assumption, among others. I read it, and wondered: What is the Internet’s optimal number of nodes and connections? When did the value of a larger Internet network start diminishing?

At some point, ISPs (Internet Service Providers) stopped charging users for access, as the business of delivering content became more valuable than providing greater network connectivity. AOL charged for service until 2002 or so.

I thought it would be helpful to begin with a timeline of Internet growth, by number of sites connected and corresponding events, as a starting point for determining incremental value. I searched for a streamlined history, but the best that I could find is provided by The Computer History Museum, and it isn’t quite linear. It also has a lot of technical detail that isn’t relevant for verifying Metcalfe’s Law. I decided to construct a timeline of dates and nodes, from which connectivity can be determined. I am writing this partly for myself, for reference purposes. (I don’t know how to value connectivity, not yet.)

In the beginning

In the beginning, the Internet had only two nodes. It was called the ARPANET. (more…)

Published in: on 25 November 2016 at 6:41 am  Comments (10)  
Tags: , , , ,

Oil prices and OPEC influence

Light, sweet crude is the most desirable grade of crude oil because it requires minimal refining while producing the most gasoline. This chart is useful when considering geopolitical risk and commodities prices, as it illustrates where the “best” oil is.

Comparison of oil types by country

Oil types by country (click image to view full-sized)

The chart was produced by the U.S. Department of Energy in 2012. Perhaps that is why West Texas Intermediate (WTI) crude is not listed, as the U.S. was not an oil exporting nation until recently, under President Obama’s administration, although we are not a net oil exporter.

OPEC

The Organization of Petroleum Exporting Countries has had varying levels of power since its founding in 1960 and heyday in the 1970s. Saudi Arabia has always been the controlling producer in the cartel. OPEC’s objective is to control oil price by either freezing production or cutting production.

Iran is an OPEC member. (more…)

Published in: on 4 March 2016 at 2:31 am  Comments (3)  
Tags: , , , ,

The EPA is not the Federal Reserve of oil markets

Energy market pricing behavior seems contrary to the relationship between supply and demand. The oddly behaving RIN market is an intermediate factor that influences gasoline prices for automobiles. RIN (Renewable Identification Numbers) should be decreasing. Instead, they are too high.

Bio-fuel pricing anomaly

RIN establish compliance with standards for non-fossil fuel usage, specifically, for corn-based ethanol as a blend in gasoline. In 2007, legislation was passed to encourage greater use of ethanol. The percentage requirement of ethanol is set by the EPA. It increases annually, and is calculated at an aggregate level, measured volumetrically, over all U.S. domestic consumption.

My favorite energy blog, Platt’s Oil Barrel, featured a guest post* by former Special Assistant to President Obama and Senior Director for Energy and Climate Change of the National Security Council Jason Bordoff, explaining anomalous RIN price behavior, and what the EPA is doing about it. He noted two reasons for the seemingly anomalous pricing.

Hitting the blend wall

Renewable Fuel Standards (RFS) were revised in 2007, based on the assumption that gasoline usage would increase over time. In fact, it has not done so, not consistently. Instead, it decreased during 2011-2013, yet the schedule of increasing amounts of ethanol has remained, as legislated. As a result, according to Bordoff, we are now hitting the “blend wall”, when blenders physically cannot put enough ethanol into the gas supply to comply with RFS law.

Bordoff identified a second reason:

broad-based skepticism in the market that EPA will use its waiver authority to avoid the blend wall—even though EPA just went to unusual lengths to signal precisely that it will.

Federal Reserve v. EPA: Powers and purpose

The bio-fuel situation bears an odd resemblance to the rational expectations based logic of monetary policy. It is difficult for the Federal Reserve to effectively signal to markets, e.g. the anticipated (and appropriate!) end of quantitative easing. The Federal Reserve System has taken measures to increase transparency. Fed Governors Bernanke and Yellen hold scheduled press conferences. Bernanke was the first Federal Reserve governor to do so. The Fed was audited by the GAO in 2012. Federal Open Markets Committee (FOMC) meeting notes are published and posted online.

The Fed also has the necessary tools to carry out monetary policy e.g. quantitative easing known as QE.

Despite all of the above, the “job creators” aren’t investing, and the Fed is now contemplating QE4. (more…)

Published in: on 13 October 2014 at 7:54 am  Comments (8)  
Tags: , , , , ,