Oil prices and OPEC influence

Light, sweet crude is the most desirable grade of crude oil because it requires minimal refining while producing the most gasoline. This chart is useful when considering geopolitical risk and commodities prices, as it illustrates where the “best” oil is.

Comparison of oil types by country

Oil types by country (click image to view full-sized)

The chart was produced by the U.S. Department of Energy in 2012. Perhaps that is why West Texas Intermediate (WTI) crude is not listed, as the U.S. was not an oil exporting nation until recently, under President Obama’s administration, although we are not a net oil exporter.

OPEC

The Organization of Petroleum Exporting Countries has had varying levels of power since its founding in 1960 and heyday in the 1970s. Saudi Arabia has always been the controlling producer in the cartel. OPEC’s objective is to control oil price by either freezing production or cutting production.

Iran is an OPEC member. (more…)

Published in: on 4 March 2016 at 2:31 am  Comments (3)  
Tags: , , , ,

The EPA is not the Federal Reserve of oil markets

Energy market pricing behavior seems contrary to the relationship between supply and demand. The oddly behaving RIN market is an intermediate factor that influences gasoline prices for automobiles. RIN (Renewable Identification Numbers) should be decreasing. Instead, they are too high.

Bio-fuel pricing anomaly

RIN establish compliance with standards for non-fossil fuel usage, specifically, for corn-based ethanol as a blend in gasoline. In 2007, legislation was passed to encourage greater use of ethanol. The percentage requirement of ethanol is set by the EPA. It increases annually, and is calculated at an aggregate level, measured volumetrically, over all U.S. domestic consumption.

My favorite energy blog, Platt’s Oil Barrel, featured a guest post* by former Special Assistant to President Obama and Senior Director for Energy and Climate Change of the National Security Council Jason Bordoff, explaining anomalous RIN price behavior, and what the EPA is doing about it. He noted two reasons for the seemingly anomalous pricing.

Hitting the blend wall

Renewable Fuel Standards (RFS) were revised in 2007, based on the assumption that gasoline usage would increase over time. In fact, it has not done so, not consistently. Instead, it decreased during 2011-2013, yet the schedule of increasing amounts of ethanol has remained, as legislated. As a result, according to Bordoff, we are now hitting the “blend wall”, when blenders physically cannot put enough ethanol into the gas supply to comply with RFS law.

Bordoff identified a second reason:

broad-based skepticism in the market that EPA will use its waiver authority to avoid the blend wall—even though EPA just went to unusual lengths to signal precisely that it will.

Federal Reserve v. EPA: Powers and purpose

The bio-fuel situation bears an odd resemblance to the rational expectations based logic of monetary policy. It is difficult for the Federal Reserve to effectively signal to markets, e.g. the anticipated (and appropriate!) end of quantitative easing. The Federal Reserve System has taken measures to increase transparency. Fed Governors Bernanke and Yellen hold scheduled press conferences. Bernanke was the first Federal Reserve governor to do so. The Fed was audited by the GAO in 2012. Federal Open Markets Committee (FOMC) meeting notes are published and posted online.

The Fed also has the necessary tools to carry out monetary policy e.g. quantitative easing known as QE.

Despite all of the above, the “job creators” aren’t investing, and the Fed is now contemplating QE4. (more…)

Published in: on 13 October 2014 at 7:54 am  Comments (8)  
Tags: , , , , ,

Radiation levels in Japan and the U.S.A.

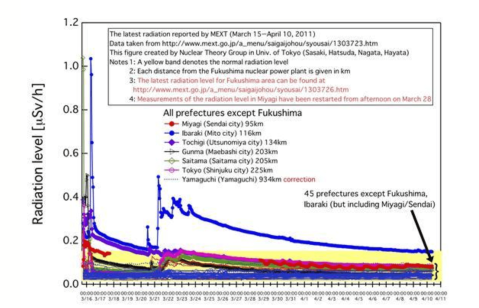
Radiation levels in Japan post-Fukushima

The source for this chart is Ryugo Hayano, Ph.D. Professor Hayano is the Physics Department chair at The University of Tokyo. Click on the chart to view a larger version, with higher resolution. It used to link directly to the Hayano account on one, then another image sharing site, but both are out of business now. (Lack of persistent URLs is a problem everywhere.)

time series chart of radiation levels

Radiation levels in Japan March 15 to April 10, 2011

I offer my thanks to @hayano and Daniel Garcia. Daniel R. Garcia Ph.D. is a nuclear scientist from France, doing a postdoc at TEPCO, in Fukushima. He was there prior to the earthquake and tsunami. Daniel frequently sends updates as @daniel_garcia_r. He works at the reactor site every day, takes photos, and makes them available via Twitter.

Fukushima nuclear plant

Control board of Fukushima 1 nuclear power plant when all was well

Both Daniel and Professor Hayano are reliable, because they never confuse Becquerel with Sievert with Roentgen. They know radio-isotopes and their half-lives better than nearly anyone. Daniel was needed to assist the press a few weeks ago, when there was confusion between Cesium 137 versus Iodine 137 and again between Iodine 131 versus Uranium 137.

Other locales, other radiation levels

The Radiation Network is an excellent resource for radiation information in the U.S.A. and other parts of the world. It is a network of civilian volunteers using a protocol to report radiation readings, 24 hours a day, 7 days a week. Sensor stations are located throughout the contiguous 48 states, Hawaii,  Alaska and Norway. There was one in Northern Japan. Sadly, that sensor went off-line last month.

The Radiation Network is non-profit, all volunteer and headquartered in Arizona. Tim is the public face of the Radiation Network. Using software developed for this purpose, Tim collects and aggregates the real-time data from the sensor stations, then updates the map online with the readings at one-minute intervals. The Radiation Network went online nearly a decade ago, and offers reliable baseline measurements for comparison. This facilitates detection of any incident. The criteria for elevated radiation levels include:

  • Rule-out protocol for false positives, e.g. spikes due to sensors  malfunctioning;
  • Level of radiation that is significant: Higher than the threshold AND sustained, and how long “sustained” is;
  • Exogenous causes such as geography. Readings in Colorado are always higher due to the higher elevation,

The website is basic but functional. There are Radiation Network maps of Europe, Japan, and the US (broken out for Alaska and Hawaii), and a message. The message is a running log of updates.

Published in: on 10 April 2011 at 8:59 am  Comments (1)  
Tags: , , , ,